I love vintage camera lenses. They have great character, and they’re cheap (sometimes). But the vintage lenses people want are mostly from the 1970’s and 1980’s, meaning that some of them are pushing 50 years old.
I needed a way to compare lens sharpness across F-stops for an upcoming YouTube video. So I opened up my IDE and created the Lens Analysis Suite — a new open-source tool that turns your camera and a simple test chart into a complete lens analysis system.
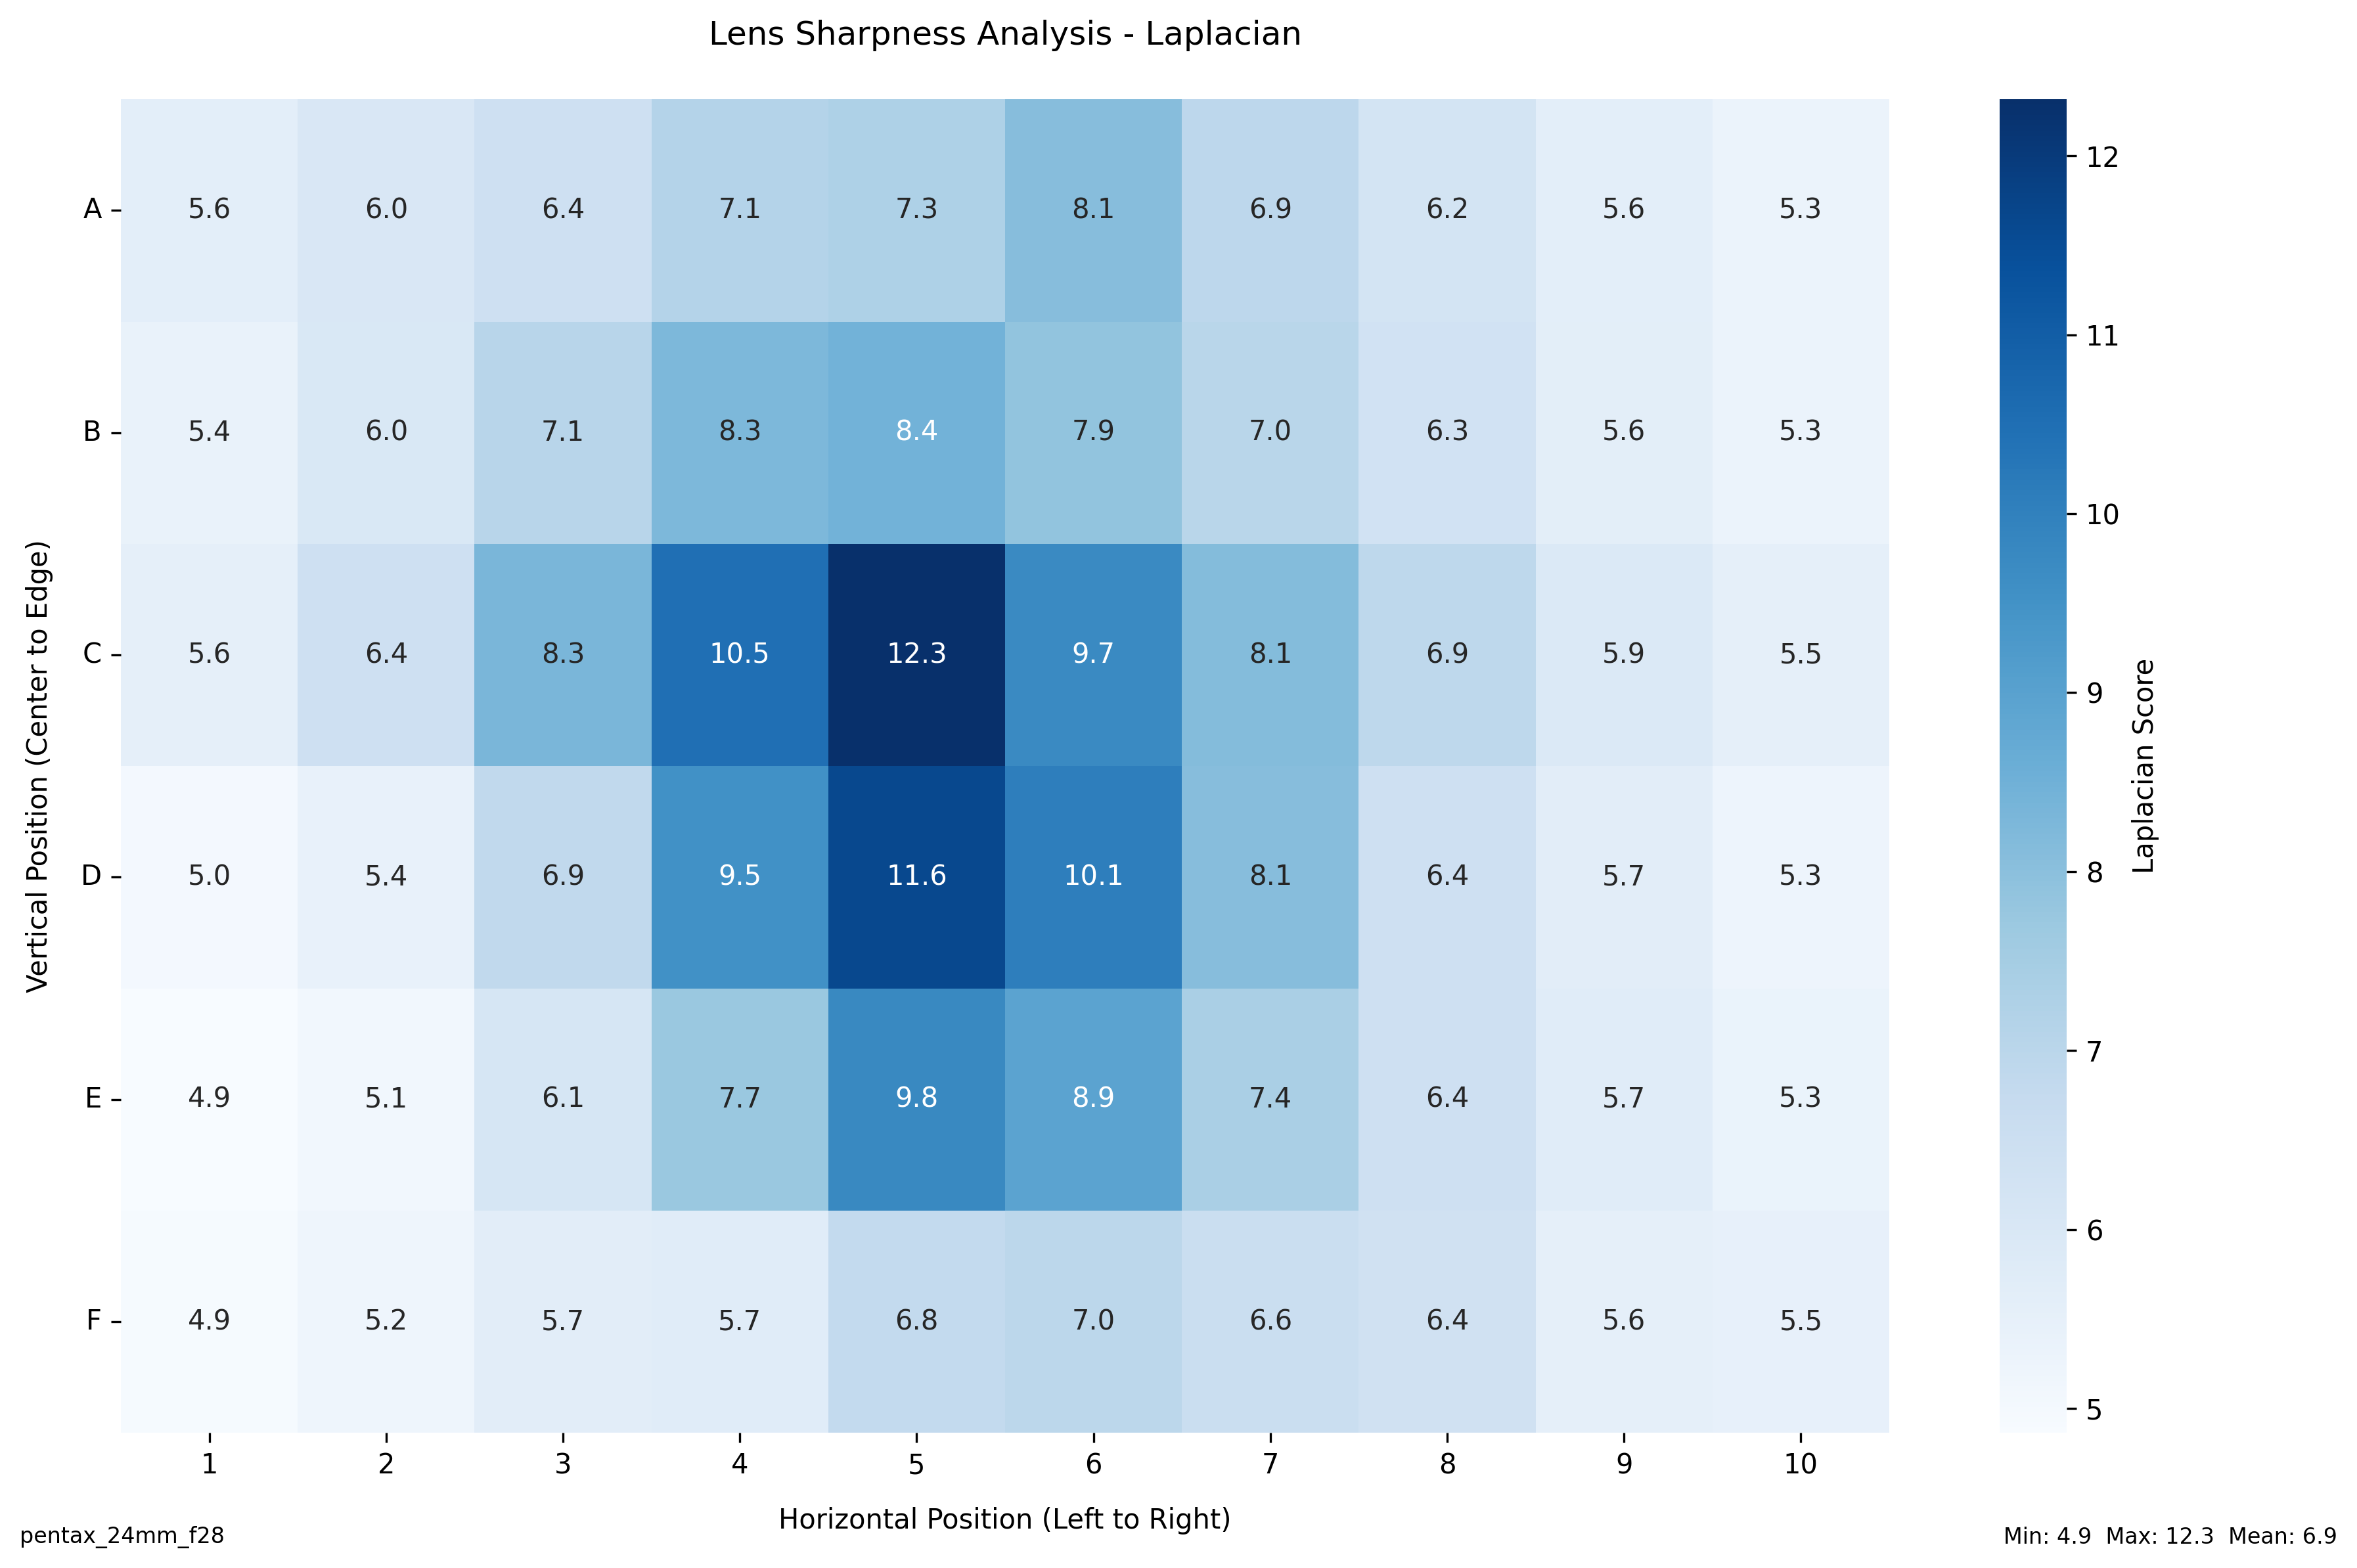
In short, this tool takes test chart photos and analyzes them using three different mathematical approaches: Laplacian variance (which looks at local contrast), Sobel gradient (which examines intensity changes), and the Tenengrad algorithm (which provides noise-resistant edge detection). What you get in return is a detailed heatmap showing exactly how sharp your lens is across the entire frame.
The real magic here is just how straightforward it is. Instead of requiring specialized charts or complicated setups, you can use a simple right-angle checkerboard pattern printed on adhesive photo paper. I actually grabbed mine from a stock photo site, but you could easily recreate it in Photoshop. Just stick it to some foam board, set up your camera on a tripod, and you’re ready to start testing.
There are some tricks to getting good results, though. You’ll want to shoot at the lowest possible ISO – the Laplacian variance test gets thrown off by noise. This gets tricky at higher f-stops since you need longer shutter speeds, but that’s why the tripod is essential. I’d also recommend using a 2-second timer or remote shutter to avoid any camera shake.
The software itself is pretty straightforward to use. Point it at a directory of test images, tell it how many sections you want to analyze, and it’ll spit out detailed reports and heatmaps showing exactly how your lens performs. Everything is normalized to scores from 1-100 for easy comparison between different lenses.
What’s really cool is that you can see patterns that might not be obvious just by pixel-peeping your photos. Some lenses are remarkably consistent across the frame, while others fall off dramatically in the corners. And because everything is quantified, you can actually compare different lenses objectively rather than arguing about subjective impressions.
I’ve released the whole thing under a Creative Commons license (CC BY-NC 4.0) because I want people to use it, improve it, and hopefully help push lens testing forward. The code is up on GitHub, and while it does require some basic Python knowledge to get running, I’ve tried to make the setup as painless as possible.
Will this replace professional lens testing labs? Probably not. But for photographers who want to really understand their gear, reviewers looking to add some hard data to their articles, or even manufacturers doing preliminary testing, it provides a powerful set of tools that anyone can use.
The next time someone tells you a lens is “sharp in the center but soft in the corners,” you can actually put some numbers behind that claim. And that’s pretty cool.

Be First to Comment